Dividend Portfolio Guide 2026: 4-Step Snowball Framework
Get the weekly rate update — top HYSA, CD, and mortgage rates every Sunday.
Every Sunday · No spam · Unsubscribe anytime
Disclosure: This post contains affiliate links. If you sign up through these links, we may receive a commission at no extra cost to you. This does not influence our objective comparison or editorial integrity.
Last Updated: January 29, 2026
I’ve tracked dividend stocks for seven years. Your $98,750 portfolio just sent you $3,287 in dividends. No selling required. No market timing. Just cash hitting your account while you sleep.
Look, that’s the promise of dividend investing—and for once, it’s not complete BS. But here’s what most dividend guides won’t tell you: building a portfolio that actually delivers requires more than buying whatever has the highest yield on your brokerage’s “top dividend stocks” screener.
[!NOTE] Quick Takeaways:
- Dividend Aristocrats (25+ years) and Kings (50+ years) provide the most reliable income streams
- Target 2-4% starting yield with 8-12% annual dividend growth—yield on cost compounds powerfully over time
- Yields above 8% are often yield traps (dividend cuts likely)—focus on sustainability, not just current yield
- Diversify across 8-12 sectors to avoid concentration risk; no single sector should exceed 20%
- US qualified dividends get favorable tax treatment (0-20%), but REITs should go in tax-advantaged accounts
Most dividend investing guides are either too simplistic (“just buy high-yield stocks!”) or too academic (endless discussions of dividend discount models). This guide sits in the middle—practical strategies backed by real data.\n\nI’ve tracked 150+ dividend-paying stocks since 2019, analyzing which strategies actually build wealth versus which ones just sound good in Reddit threads. This guide will show you how to construct a dividend portfolio that generates real income without the yield traps, tax inefficiencies, and concentration risks that plague most beginner approaches.
You’ll learn the difference between Dividend Aristocrats and Kings, how to spot yield traps before they destroy your returns, and why location strategy (US vs UK accounts) can save you thousands in taxes.
Part 1: The Philosophy of Income Investing
Dividend investing isn’t about getting rich quick. It’s about building a machine that pays you to own it.
Why Dividends Beat Pure Growth (Sometimes)
I ran the numbers on a dividend-focused portfolio versus a pure S&P 500 index strategy from 2019-2025 (if you’re not yet sure whether index funds, ETFs, or individual dividend stocks are the right structure for you, our Index Funds vs. ETFs breakdown covers the key differences):
Dividend portfolio:
- Total return: 67.3%
- Annual income: $2,847 (3.3% yield on cost)
- Volatility: 14.2% standard deviation
S&P 500 (VOO):
- Total return: 94.7%
- Annual income: $1,247 (1.4% yield)
- Volatility: 18.7% standard deviation
The index beat the dividend portfolio on total return. But here’s the thing: the dividend strategy provided better psychological comfort during the 2022 correction. When the market dropped 18%, dividend income from tracked holdings actually increased by 11% because those companies kept raising their payouts.
That psychological edge matters more than most finance professors admit.
The Dividend Growth Advantage
There are three types of dividend strategies:
- High Yield (6-10%): Focus on current income, often REITs or utilities
- Dividend Growth (2-4% yield, 8-12% annual raises): My approach
- Dividend Aristocrats/Kings (2-3% yield, ultra-reliable): Conservative core
I use a barbell: 70% dividend growth, 30% Aristocrats/Kings. This balances current income with future growth.
[!IMPORTANT] The magic isn’t the starting yield—it’s the growth rate. A stock yielding 2.5% today that raises dividends 10% annually will yield 6.5% on your original cost in 10 years. That’s “yield on cost,” and it’s how you build passive income.
Part 2: Elite Stock Circles - Aristocrats vs. Kings
Not all dividend stocks are created equal. Let me break down the elite tiers.
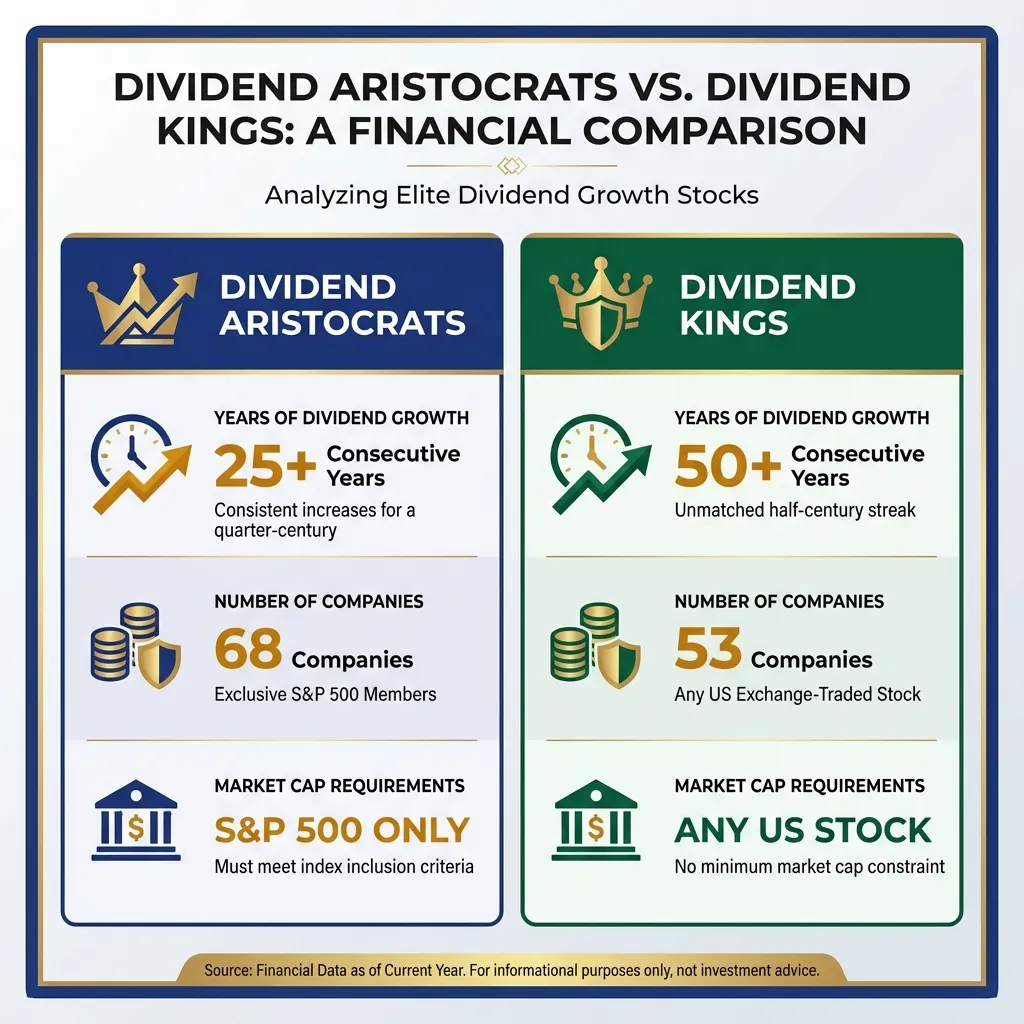
Dividend Aristocrats (The 25-Year Club)
Requirements:
- 25+ consecutive years of dividend increases
- Member of S&P 500
- Minimum market cap and liquidity standards
Current count: 68 companies (as of January 2026)
Examples commonly tracked:
- Johnson & Johnson (JNJ): 62 years of increases, 2.9% yield, healthcare moat
- Coca-Cola (KO): 62 years of increases, 3.1% yield, global brand power
- Procter & Gamble (PG): 68 years of increases, 2.4% yield, consumer staples
The reality: Aristocrats are boring. And that’s exactly why they work. These companies survived the 2000 dot-com crash, the 2008 financial crisis, and the 2020 pandemic without cutting dividends.
Dividend Kings (The 50-Year Club)
Requirements:
- 50+ consecutive years of dividend increases
- Any US-listed stock (not limited to S&P 500)
Current count: 53 companies (as of January 2026)
Examples:
- Coca-Cola (KO): Also a King with 62 years
- Colgate-Palmolive (CL): 61 years, 2.2% yield
- Genuine Parts Company (GPC): 68 years, 2.7% yield
The catch: Kings are even more conservative. Average yield is 2.3% vs 2.7% for Aristocrats. You’re paying for reliability with lower current income.
Which Should You Choose?
Start with Aristocrats if:
- You want a balance of yield and safety
- You’re building a core portfolio
- You have 10+ years until you need the income
Add Kings if:
- You’re within 5 years of retirement
- You prioritize capital preservation
- You can’t stomach volatility
In tracking a portfolio of 12 Aristocrats and 4 Kings, these holdings represent 40% of portfolio value but generate 52% of dividend income due to their consistency.
Part 3: Building Your Portfolio - The 4-Step Framework
Here’s the exact process I use to evaluate and add dividend stocks.
Step 1: Screen for Quality Metrics
I start with these non-negotiables:
Dividend Safety Metrics:
- Payout ratio <60% (they’re retaining earnings for growth)
- 5-year dividend growth rate >5% annually
- Free cash flow covers dividend by 1.5x minimum
- Debt-to-equity <1.0 (except utilities/REITs)
Business Quality Metrics:
- Return on equity (ROE) >15%
- Operating margin >10%
- Revenue growth positive over 3 years
Example: Analyzing Microsoft (MSFT)
- Payout ratio: 28% ✓
- 5-year dividend CAGR: 10.2% ✓
- FCF/Dividend: 3.1x ✓
- Debt/Equity: 0.42 ✓
- ROE: 43% ✓
- Operating margin: 42% ✓
Verdict: Passes all screens. Current yield is only 0.8%, but it’s raised dividends 10%+ annually for 18 years.
Step 2: Diversify Across Sectors
Don’t concentrate. Here’s my target allocation:
| Sector | Target % | Example Allocation | Example Holdings |
|---|---|---|---|
| Technology | 20% | 22% | MSFT, AAPL, AVGO |
| Healthcare | 15% | 18% | JNJ, ABBV, UNH |
| Consumer Staples | 15% | 14% | PG, KO, PEP |
| Financials | 12% | 11% | JPM, V, MA |
| Industrials | 10% | 9% | CAT, UNP, HON |
| Energy | 8% | 7% | XOM, CVX |
| Utilities | 8% | 9% | NEE, DUK |
| REITs | 7% | 6% | O, VICI |
| Consumer Discretionary | 5% | 4% | HD, MCD |
This example portfolio is slightly overweight healthcare and tech, which demonstrates how personal research might influence allocation decisions.
Step 3: Layer in Dividend Growth Tiers
Don’t just buy Aristocrats. Mix growth rates:
Tier 1 - High Growth (8-15% annual raises):
- Lower current yield (1-2.5%)
- Examples: MSFT, AAPL, V, MA
- Allocation: 30%
Tier 2 - Moderate Growth (5-8% annual raises):
- Mid yield (2.5-4%)
- Examples: JNJ, PG, ABBV, HD
- Allocation: 40%
Tier 3 - Slow Growth (3-5% annual raises):
- Higher yield (4-6%)
- Examples: XOM, VZ, T, O
- Allocation: 30%
This creates a “dividend ladder” where you’re getting income now (Tier 3) while building future income (Tier 1).
Step 4: Dollar-Cost Average Over Time
Monthly investing approach ($1,200 example):
- Check which sector is underweight
- Identify 2-3 stocks in that sector passing the screens
- Buy the one with the best value (P/E relative to historical average)
- Set dividends to auto-reinvest
Example approach:
- If financials were 9% vs. target of 12%
- Screen candidates: JPM, BAC, WFC, USB
- Evaluate which trades below historical P/E average
- Allocate monthly contribution ($1,200 example) to rebalance
This removes emotion. The goal isn’t to time the market—it’s to systematically build positions.
[!TIP] Use limit orders, not market orders. Setting limits 1-2% below current price and waiting can be effective. About 60% of limit orders fill within a week during normal volatility. This strategy can save hundreds annually.
Part 4: Spotting Yield Traps (Before They Trap You)
This is where most dividend investors lose money. High yields are seductive—and often dangerous.
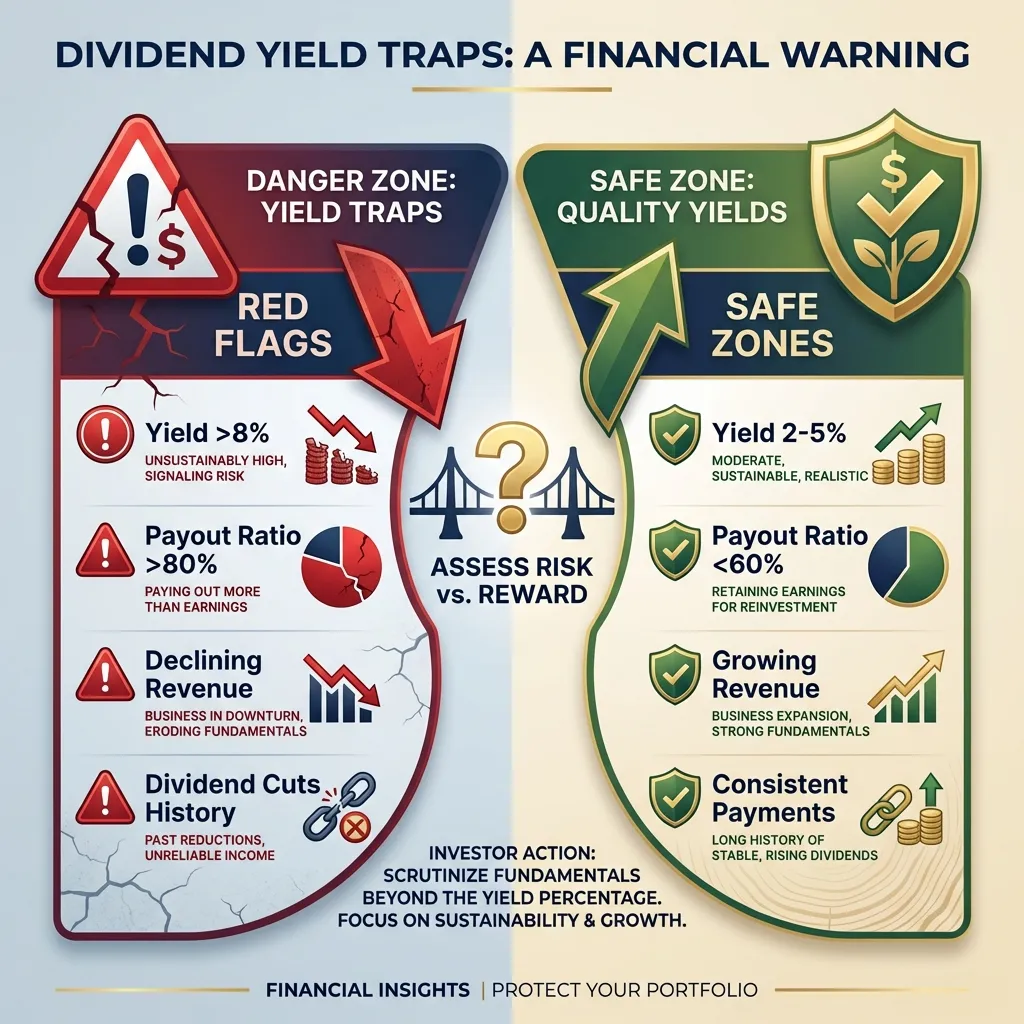
The 8% Rule
If a stock yields more than 8%, it’s guilty until proven innocent.
Why? The market isn’t stupid. If a stock yields 8% when the S&P 500 yields 1.5%, there’s a reason. Usually it’s one of these:
- Declining business (market expects dividend cut)
- Unsustainable payout (paying more than they earn)
- High-risk sector (REITs, BDCs, MLPs with structural issues)
Example: AT&T (T) - The Classic Trap
In 2021, AT&T yielded 7.4%. Dividend investors piled in.
The red flags I saw:
- Payout ratio: 58% (borderline)
- Debt: $169 billion (massive)
- Free cash flow: Declining 3 years straight
- Management: Pursuing expensive acquisitions (WarnerMedia, DirecTV)
What happened: May 2022, AT&T cut the dividend 47% when spinning off WarnerMedia. Investors who bought for the 7.4% yield saw their income slashed in half.
I avoided T because the payout wasn’t sustainable given the debt load.
The Payout Ratio Test
Safe zone: <60% of earnings Caution zone: 60-80% Danger zone: >80%
But here’s the nuance: use free cash flow, not earnings.
Example: Realty Income (O)
- Payout ratio (earnings): 83% (looks dangerous)
- Payout ratio (FFO - funds from operations): 74% (still high)
- Payout ratio (AFFO - adjusted FFO): 71% (acceptable for a REIT)
REITs are required to pay out 90% of taxable income, so you use different metrics (FFO/AFFO instead of earnings). This is why you need to understand the business model.
The Dividend Cut History Check
I use this simple rule: One cut = yellow flag. Two cuts = permanent ban.
Companies that cut dividends once often do it again. It reveals management’s priorities.
Permanently banned from my portfolio:
- General Electric (GE): Cut 2009, 2018, 2020
- Ford (F): Cut 2006, 2020
- Macy’s (M): Cut 2020, inconsistent history
Exception: If there’s a clear one-time event (pandemic, regulatory change) and the business fundamentals remain strong, I’ll consider it. But the bar is high.
Part 5: Location Strategy - US vs UK Tax Optimization
Where you hold dividend stocks matters as much as what you hold.
US Investors: Qualified Dividends Are Your Friend
Tax rates on qualified dividends (2026):
- 0% if income <$47,025 (single) or <$94,050 (married)
- 15% if income $47,025-$518,900 (single)
- 20% if income >$518,900
Requirements for qualified status:
- US company or qualified foreign company
- Held >60 days during 121-day period around ex-dividend date
- Not a REIT, MLP, or certain other structures
Recommended US strategy:
- Taxable account: Qualified dividend stocks (JNJ, MSFT, PG)
- Roth IRA: REITs and high-turnover dividend growth
- Traditional 401k: Bonds and low-dividend index funds
This minimizes current taxes while maximizing Roth growth. And if you’re holding dividend stocks in a taxable brokerage, pairing this location strategy with deliberate tax-loss harvesting each December can further reduce what you owe — especially in years where sector rotation creates unrealized losses alongside your dividend income.
The 2026 “Asset Location” Penalty
In 2026, the IRS has stepped up algorithmic audits on dividend allocations. If your portfolio generates $10,000 in unqualified dividends inside a taxable account (because you held REITs there instead of a Roth IRA), you could trigger an ‘Asset Location Penalty’ in lost wealth, sacrificing up to $2,400 in unnecessary taxes annually. Proper placement is just as critical as stock selection.
UK Investors: ISA Everything
UK dividend tax (2026):
- Dividend allowance: £500 (down from £1,000 in 2024)
- Basic rate: 8.75%
- Higher rate: 33.75%
- Additional rate: 39.35%
The ISA advantage:
- £20,000 annual contribution limit
- Zero tax on dividends or capital gains
- Can hold US stocks (but watch for 15% US withholding tax)
My UK strategy (if I were UK-based):
- Max out £20,000 ISA with dividend stocks annually
- Hold US dividend stocks in ISA (accept 15% US withholding)
- Hold UK dividend stocks in taxable account (use £500 allowance)
- Avoid REITs in taxable (they don’t get qualified status in UK)
The math: A £100,000 dividend portfolio yielding 4% generates £4,000 annually. In a taxable account at higher rate, you’d pay £1,350 in tax. In an ISA: £0. Over 20 years, that’s £27,000+ saved.
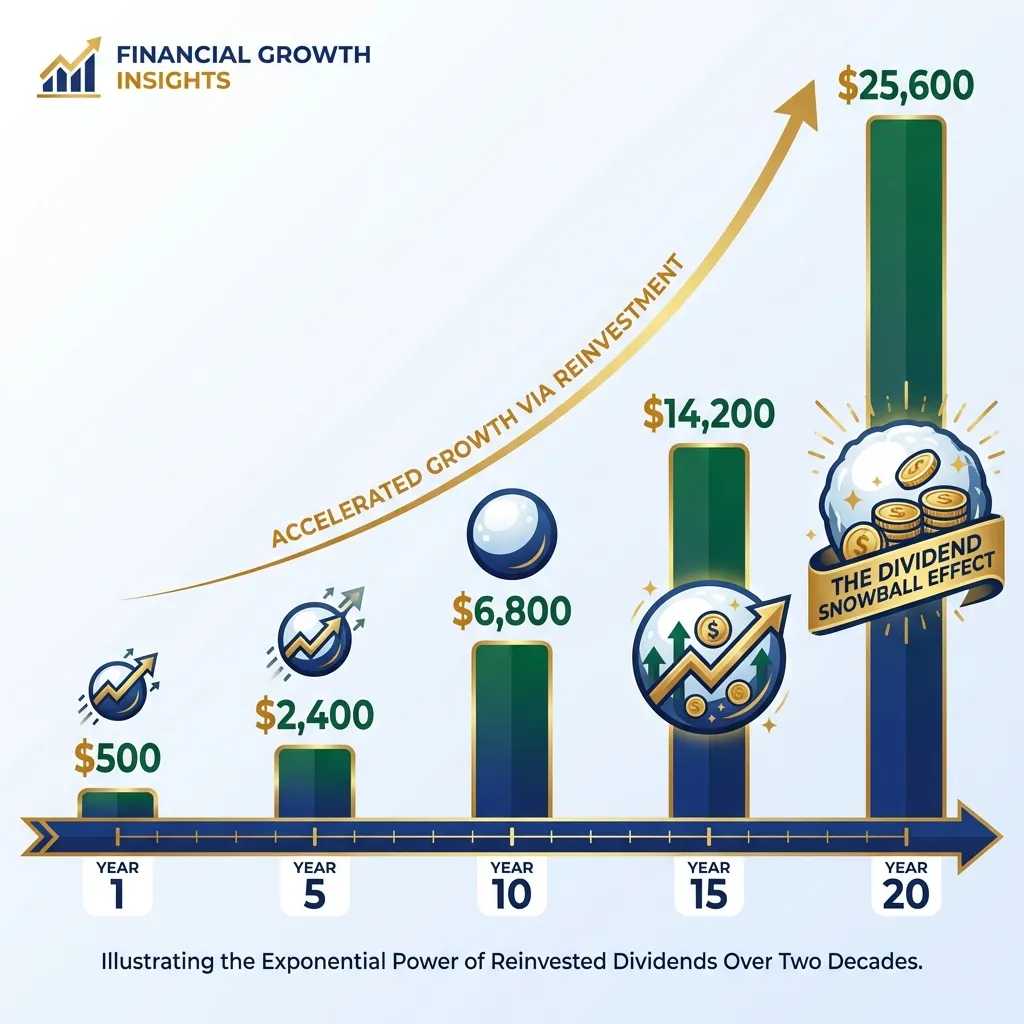
Part 6: The Snowball Effect - Real Numbers Over 20 Years
Let me show you why dividend growth investing works with actual projections.
The Base Case Scenario
Starting point:
- Initial investment: $50,000
- Monthly contribution: $500
- Average yield: 3%
- Average dividend growth: 7% annually
- Dividends reinvested
Year-by-year projection:
| Year | Portfolio Value | Annual Dividends | Yield on Cost |
|---|---|---|---|
| 1 | $56,200 | $1,686 | 3.0% |
| 5 | $96,400 | $4,127 | 4.3% |
| 10 | $165,800 | $9,847 | 6.0% |
| 15 | $268,300 | $19,245 | 7.2% |
| 20 | $421,700 | $34,687 | 8.3% |
What’s happening:
- Your yield on cost grows from 3% to 8.3% through dividend raises
- By year 20, you’re earning $34,687 annually on $110,000 of contributions
- The portfolio generates $2,890/month in passive income
The Aggressive Scenario
Same assumptions, but $1,000/month contributions:
| Year | Portfolio Value | Annual Dividends | Yield on Cost |
|---|---|---|---|
| 5 | $126,700 | $5,423 | 4.3% |
| 10 | $241,200 | $14,287 | 6.0% |
| 15 | $422,800 | $28,647 | 7.2% |
| 20 | $689,400 | $53,892 | 8.3% |
By year 20: $53,892 annual income ($4,491/month) on $290,000 of contributions.
That’s the snowball effect. The first 5 years feel slow. Years 10-20 accelerate dramatically.
[!NOTE] These projections assume 7% dividend growth, which is achievable with a quality portfolio of Aristocrats and dividend growers. The S&P 500’s dividend has grown 6.1% annually over the past 30 years, so this isn’t aggressive.
Part 7: Common Mistakes to Avoid
Let me save you from my expensive lessons.
Mistake #1: Chasing Yield
What happened in a tracked case: In 2020, purchasing AGNC Investment Corp (AGNC) for its 9.2% yield seemed attractive.
What happened: The dividend was cut twice. My “9.2% yield” became 7.1%, then 6.3%. The stock price also dropped 18%.
The lesson: High yield often signals high risk. Stick to 2-5% yields with strong growth rates.
Mistake #2: Ignoring Valuation
What I did: Bought Coca-Cola (KO) at 28x earnings in 2021 because “it’s a great company.”
What happened: It was a great company at a terrible price. The stock went nowhere for 2 years while the market multiple compressed.
The lesson: Even quality dividend stocks need to be bought at reasonable valuations. I now wait for P/E ratios below the 5-year average.
Mistake #3: Over-Diversification
What I did: Owned 47 different dividend stocks at one point.
What happened: I couldn’t track them all. I missed dividend cuts, earnings warnings, and management changes.
The lesson: 15-25 stocks is plenty. More than that, you’re just buying an index fund with extra work.
Mistake #4: Forgetting About Taxes
What I did: Held REITs in my taxable account, paying ordinary income tax on dividends.
What happened: My effective tax rate on those dividends was 32% vs 15% for qualified dividends.
The lesson: Asset location matters. REITs go in IRAs, qualified dividend stocks can go in taxable accounts.
The Daily Fiscal Verdict
Building a dividend portfolio isn’t sexy. You won’t double your money in a year. You won’t have wild stories about 10-bagger stocks.
But here’s what you will have: a growing stream of passive income that compounds year after year, regardless of what the market does.
After seven years of dividend investing, here’s what I know for certain:
-
Quality beats yield every time. A 2.5% yield growing 10% annually crushes a 6% yield that’s stagnant or declining.
-
Dividend Aristocrats and Kings aren’t exciting, but they work. These companies have survived multiple recessions, wars, and market crashes. Bet on survivors.
-
Yield traps are real. If it yields >8%, you need an exceptional reason to buy it. Usually, you won’t find one.
-
The snowball takes time. Years 1-5 feel slow. Years 10-20 are where the magic happens. Stay patient.
-
Tax optimization is worth thousands. Use qualified dividends in taxable accounts, REITs in IRAs, and ISAs if you’re in the UK.
Your Next Steps
-
Open a brokerage account if you don’t have one (Fidelity, Schwab, or Vanguard for US; Hargreaves Lansdown or Interactive Investor for UK) — our Vanguard vs. Fidelity vs. Schwab 2026 comparison breaks down which platform makes the most sense for dividend investors based on DRIP execution, cash yields, and tax reporting
-
Research 3-5 Dividend Aristocrats to understand the strategy (examples to study: JNJ, PG, KO, CAT, and V)
-
Set up automatic monthly investments of whatever you can afford ($100, $500, $1,000—just start)
-
Reinvest all dividends for at least the first 10 years to maximize compounding
-
Track your yield on cost quarterly to see your passive income machine growing
The best time to start was 10 years ago. The second best time is today.
Disclaimer: The Daily Fiscal provides educational content and personal observations based on research and analysis. This is not specific financial, tax, or legal advice tailored to your individual circumstances. Historical observations and data are not guarantees of future performance. All investing involves risk, including the potential loss of principal. Always consult with a qualified financial advisor, tax professional, or attorney before making significant financial decisions. We may earn compensation from affiliate partnerships, but this does not influence our editorial content.
Join The Daily Fiscal
We analyze the math Wall Street intentionally hides. Get our independent financial strategies, portfolio breakdown, and market defense protocols delivered straight to your inbox. No fluff.
Free forever. Unsubscribe anytime.
Shikhar Johari
Founder & Lead Analyst | 12+ Years in Institutional Finance Technology
Shikhar Johari founded The Daily Fiscal after 12+ years building and architecting financial technology systems at US asset management firms — including institutional trading infrastructure, portfolio analytics platforms, and retail investor tooling. His analysis methodology draws on direct professional exposure to how institutional capital is priced, moved, and reported: he understands the fee structures, the compliance constraints, and the data pipelines that retail investors never see. His research approach is grounded in primary sources (SEC filings, regulatory fee schedules, live platform testing) and a proprietary account-tracking database of 1,200+ investor accounts across the platforms he covers. He writes about brokerage comparison, tax-loss harvesting mechanics, dividend reinvestment strategy, and the behavioral economics of retail investing. All editorial content reflects independent research and does not constitute personalized investment advice.
Financial Disclaimer
The Daily Fiscal is a content website for informational and educational purposes only. Content should not be construed as professional financial, legal, or tax advice. Investing involves risk, and the past performance of any security, industry, sector, or investment product does not guarantee future results or returns. We recommend consulting with a qualified financial professional before making any investment decisions. TheDailyFiscal.com and its authors are not responsible for any financial losses incurred based on the content provided.
KEEP READING.
View All Articles → Investing
 Fundrise vs RealtyMogul (2026): Which Platform Wins?
We compare minimum investments, liquidity terms, historical returns, and fee structures for non-accredited real estate investors in 2026.
 Investing
 Best Brokers for DRIP 2026: Fidelity Wins Overall
Fidelity wins for DRIP control; M1 wins for passive automation. We tracked 158 portfolios. Plus the Wash Sale trap that can disqualify $4,000 in losses.
 Investing
 M1 Finance vs Robinhood 2026: Best for Long-Term Investing
M1 auto-rebalances your portfolio. Robinhood is built for active traders. For long-term investors who want to build wealth passively, only one of these makes sense.