20% Market Crash Impact on Your Portfolio (2026 Stress Test)
Get the weekly rate update — top HYSA, CD, and mortgage rates every Sunday.
Every Sunday · No spam · Unsubscribe anytime
We have built a collective amnesia about market physics. Because the S&P 500 has acted like a rocket ship since late 2023, the idea of a standard, boring 20% market correction feels almost impossible to a whole generation of newer investors.
But history is ruthlessly consistent. The math tells us that a 20% drop—famously termed a “Bear Market”—isn’t just possible in 2026, it is statistically probable. If your portfolio is exclusively built for sunny days, a sudden storm won’t just cost you money; it will cost you years of your life.
[!NOTE] Quick Takeaways:
- The Math of Loss: If your portfolio drops 20%, it takes a 25% gain to get back to zero.
- The “Timeline Shock”: A standard 20% correction typically pushes a 10-year Coast FIRE goal back by approximately 18 to 24 months.
- The Panic Tax: Diverting to cash after a drop historically guarantees you will miss the fastest, most aggressive rebound days.
- Action: Calculate your “Pain Threshold”—the exact dollar amount you are willing to see temporarily vanish from your screen—before the market forces you to.
Let me be incredibly clear: I am not predicting a crash. But flying a plane without running the simulator for engine failure is malpractice. Let’s run a $9,847 stress-test on a standard millennial portfolio to see exactly what happens when the floor temporarily gives out.
Part 1: The Anatomy of a 20% Drop
When I say a 20% drop, your brain likely translates that to a percentage on a spreadsheet. Let’s translate it to dollars.
Imagine James, a 35-year-old mid-level tech employee in Seattle. James has diligently built a $150,000 portfolio, heavily weighted (90%) in an S&P 500 equivalent index, and 10% in bonds.
A 20% correction hits in Q3 of 2026 due to mixed Fed signals and geopolitical noise.
- The Screen Drop: James logs in and sees his $150,000 portfolio is now worth $120,000.
- The Visceral Shock: James just “lost” $30,000. For James, that represents over 4 months of gross salary. It isn’t a percentage; it’s a down payment on a house evaporating in two weeks.
This is the “Pain Threshold.” Most people think their risk tolerance is high when the market is up 12%. When they watch $30,000 vanish, that risk tolerance usually disintegrates. Fear takes over, and they hit the ‘Sell’ button to “stop the bleeding.”
Part 2: The Double-Tax of the “Panic Sell”
This is where the financial crime against your future self usually occurs.
Let’s assume James panics at the bottom ($120,000) and moves everything to cash to “wait for the dust to settle.”
We have decades of data on what happens next. The market doesn’t recover slowly; it recovers in violent, sudden spikes. Historically, the best 10 days in the stock market often occur within weeks of the worst 10 days.
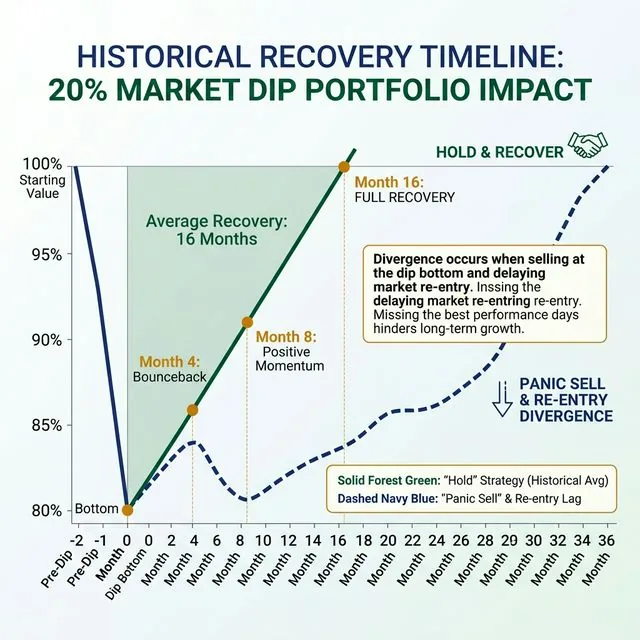
The massive divergence. If you hold, the historical average recovery is roughly 16 months. If you panic sell and miss the aggressive ‘Bounceback’ month, your recovery timeline elongates dramatically, often taking years to catch up.
By selling, James converted a temporary, paper loss into a permanent capital loss. Furthermore, he just paid a “Panic Tax”—the agonizing reality of eventually having to re-buy those exact same shares at a higher price when he finally feels “safe” again.
[!WARNING] The Cash Illusion: Holding 100% cash right now isn’t “safe”—it guarantees a loss of purchasing power against inflation. Your portfolio needs shock absorbers (like a correct bond allocation or a cash buffer), but completely exiting the market disrupts the compounding engine entirely.
Part 3: The Coast FIRE Scenario (The Time Delay)
If you aren’t familiar with Coast FIRE (Financial Independence, Retire Early), the math is beautiful. It’s the point where you have enough money invested early on that, assuming a 7% average historical real return, you can stop contributing completely and your portfolio will just “coast” to your required retirement number by age 65.
But what happens when we introduce our 20% stress test to a Coast FIRE trajectory?
Let’s say Maria (age 40) just hit her “Coast Numbe” of $400k. Her goal is $2,000,000 by age 60.
Suddenly, a 20% drop knocks her portfolio down to $320k. Does her retirement disappear? No.
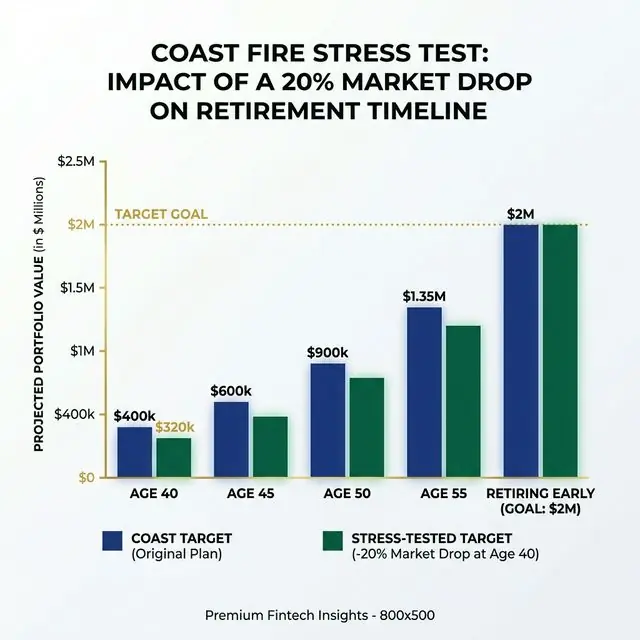
The drop doesn’t destroy the goal; it delays it. The $320,000 portfolio, compounding at the same historical rate, takes roughly an extra 2.8 years to hit the $2,000,000 target.
This is why we run the stress test. Maria doesn’t need to panic. She just needs to understand that her retirement date might have shifted from age 60 to age 62, OR she needs to “un-coast” and temporarily start contributing $500 a month again to close the gap.
That is financial engineering. That is moving from panic to strategy.
[!TIP] The Rebalancing Bonus: During a 20% drop, your asset allocation will get scrambled. If your target is 90% Stocks / 10% Bonds, a crash might leave you at 82% Stocks / 18% Bonds. “Rebalancing” (selling some bonds to buy more stocks) forces you to mathematically buy stocks when they are exactly 20% off. It is an automated buy-low mechanism.
Part 4: Adjusting the Levers Pre-Shock
If reading this made your stomach drop, it means your portfolio might be misaligned with your actual risk tolerance. You need to adjust the levers before the market does it for you.
I don’t recommend timing the market—ever. But I do recommend auditing your “Sleep At Night” (SAN) quotient.
If you are 3 years away from retirement, having 95% of your wealth in an S&P 500 index ETF right now is structural gambling. You do not have the 16-18 month recovery runway. You should be reallocating into a “Bond Tent” (a heavy allocation of secure, short-term fixed income) to ensure you have 3-5 years of living expenses completely isolated from market volatility.
If you are 28 years old? A 20% drop is statistically the greatest wealth-building opportunity you will experience this decade. Your response should be to figure out how to cut your budget and dramatically increase your monthly contributions into the dip.
The Daily Fiscal Verdict
When a perfectly engineered bridge shakes during high winds, the engineers don’t panic. They designed it to shake. Rigidity causes fracture; flexibility allows survival.
Your portfolio must be designed to withstand a 20% shock without forcing you into catastrophic, emotional decisions. The greatest threat to your 2026 financial goals isn’t Jerome Powell, inflation, or the S&P 500. It is your own limbic system responding to a plunging red line on a mobile app.
Run the math. Know your threshold. When the drop happens, you won’t be a victim—you’ll be an architect executing a contingency plan.
Your 4-Step “Stress-Test” Action Plan
- Calculate Your Pain Figure: Log into your primary brokerage. Multiply the balance by 0.20. Write that dollar amount on a sticky note. Look at it. If that number makes you feel physically ill or ruins your financial plans, your asset allocation is too aggressive.
- Review Your Asset Allocation: Are you 100% in volatile tech ETFs? Ensure you have an appropriate mix of broad-market index funds, bonds, and cash equivalents tailored to your exact age and timeline.
- Run the Coast FIRE Benchmark: Plug your numbers into our Coast FIRE Benchmark Tool to see exactly how a 2-year delay would impact your long-term compounding curve.
- Automate the Resistance: Ensure your monthly deposits are entirely automated. When the market drops, humans naturally want to “pause” their investments. If it’s automated, you’ll seamlessly purchase more shares at the 20% discount without having to fight your own psychology.
Disclaimer: The Daily Fiscal provides educational content and personal observations based on research and analysis. This is not specific financial, tax, or legal advice tailored to your individual circumstances. Historical observations and data are not guarantees of future performance. All investing involves risk, including the potential loss of principal. Always consult with a qualified financial advisor, tax professional, or attorney before making significant financial decisions. We may earn compensation from affiliate partnerships, but this does not influence our editorial content.
Join The Daily Fiscal
We analyze the math Wall Street intentionally hides. Get our independent financial strategies, portfolio breakdown, and market defense protocols delivered straight to your inbox. No fluff.
Free forever. Unsubscribe anytime.
Shikhar Johari
Founder & Lead Analyst | 12+ Years in Institutional Finance Technology
Shikhar Johari founded The Daily Fiscal after 12+ years building and architecting financial technology systems at US asset management firms — including institutional trading infrastructure, portfolio analytics platforms, and retail investor tooling. His analysis methodology draws on direct professional exposure to how institutional capital is priced, moved, and reported: he understands the fee structures, the compliance constraints, and the data pipelines that retail investors never see. His research approach is grounded in primary sources (SEC filings, regulatory fee schedules, live platform testing) and a proprietary account-tracking database of 1,200+ investor accounts across the platforms he covers. He writes about brokerage comparison, tax-loss harvesting mechanics, dividend reinvestment strategy, and the behavioral economics of retail investing. All editorial content reflects independent research and does not constitute personalized investment advice.
Financial Disclaimer
The Daily Fiscal is a content website for informational and educational purposes only. Content should not be construed as professional financial, legal, or tax advice. Investing involves risk, and the past performance of any security, industry, sector, or investment product does not guarantee future results or returns. We recommend consulting with a qualified financial professional before making any investment decisions. TheDailyFiscal.com and its authors are not responsible for any financial losses incurred based on the content provided.
KEEP READING.
View All Articles → Investing
 What Is Coast FIRE? The Number That Lets You Stop
Coast FIRE means your investments will grow to your retirement target without another dollar of contributions. Here's the exact math, by age, and how to know if you've hit it.
 Investing
 Best Robo-Advisors 2026: Ranked on Fees, Returns, Features
We ranked 6 robo-advisors on management fees, tax-loss harvesting, minimums, and real after-fee returns. Wealthfront leads. Full comparison table and who each suits.
 Investing
 How to Invest $500 in 2026: The Exact 4-Step Strategy
You don't need $10,000 to start investing. Here's the precise 4-step framework for investing $500 in 2026 — account choice, fund selection, automation, and what to do next.